This study followed a mixed-methods research methodology, combining a large-scale survey with in-depth qualitative interviews and focus group discussions. Entrepreneurial Households have been identified using a multi-dimensional framework. They typically have diversified income sources, multiple earning members and linkages to the informal economy.
The quantitative survey, conducted between August and December 2025, covered 18 states and 135 districts, representing 91% of India’s population.
Majority of respondents had more than four family members in their household
Demographic split by number of family members in the household
>4 members4 members3 members2 members
52% of all respondents were female, ensuring a near-equal split
Demographic split by gender
FemaleMale
Respondents were spread across all four regions of India
Demographic split by region in India
NorthWestSouthEast
Source: Data from EH360 survey, April 2026, EPIC World Foundation and 1Lattice analysis
The districts were selected using a five-indicator socio-economic index, calculated with metrics on private schools, Micro Small and Medium Enterprises (MSME), consumption expenditure, health insurance premium, and proportion of irrigated versus cultivated area. Each district was evaluated against national medians, and those meeting at least three thresholds were prioritized. Population-adjusted data on bank branch and ATM density were used to assess financial inclusion context of the districts.
To guide site selection, we drew on EPIC Intelligence, EPIC World’s proprietary location intelligence platform. Core Transaction Value, a foundational metric within the platform that speaks to economic vibrancy and aspiration, helped identify regions where transaction activity suggested a concentration of Entrepreneurial Households. Spatial and temporal insights on financial institution and SHG presence from EPIC Intelligence was subsequently integrated during analysis to better contextualize the responses received.
The quantitative assessment was a two-survey instrument design. It included a short questionnaire capturing core financial behavior data, intra-household dynamics, gender roles, trust and perceptions of past financial interventions and a longer survey for a subset of the sample to estimate Core Transaction Value (CTV). Both the questionnaires were translated into regional languages and had built-in validations.
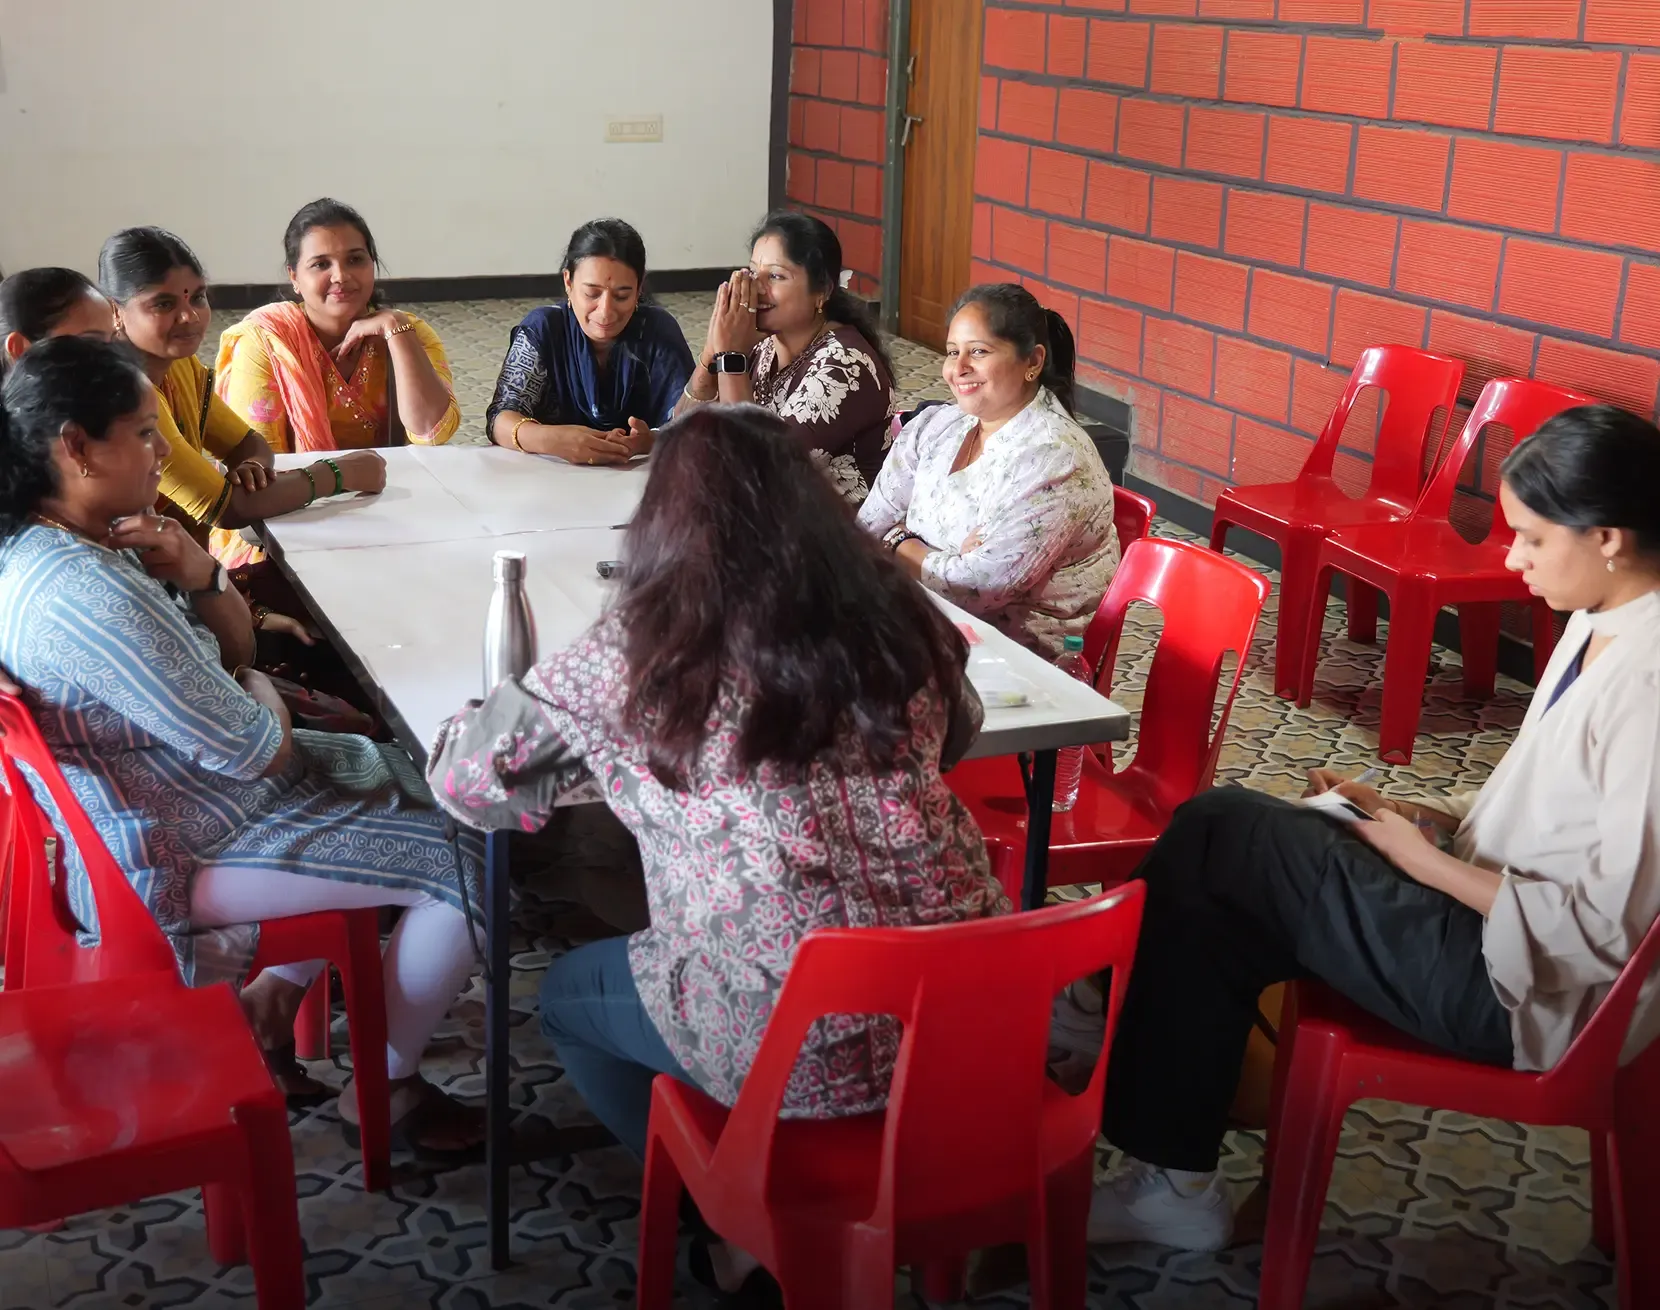
The face-to-face qualitative interviews and focus group discussions delved into lived experiences, behavioral drivers and contextual factors shaping financial decisions. Field teams were rigorously evaluated before selection, carefully trained, and had strong female representation. They were recruited by leveraging existing networks and prior relationships and local influencers facilitated introductions to establish credibility.
Before the full rollout, a pilot study of 100 respondents was conducted to test the questionnaire and the process, which shaped the final survey. Real-time monitoring of data enabled early identification of anomalies and a robust, multi-layered quality assurance framework helped safeguard data integrity. Each submission included geo-tagged photographs, partial audio recordings for audit purposes, IP address capture, and recorded informed consent.
Ethical safeguards were embedded throughout the research process. All data was anonymized prior to analysis and prior informed consent obtained from all respondents. Participation was voluntary with respondents retaining the right to skip questions or withdraw at any stage.
*Calculation of EH score
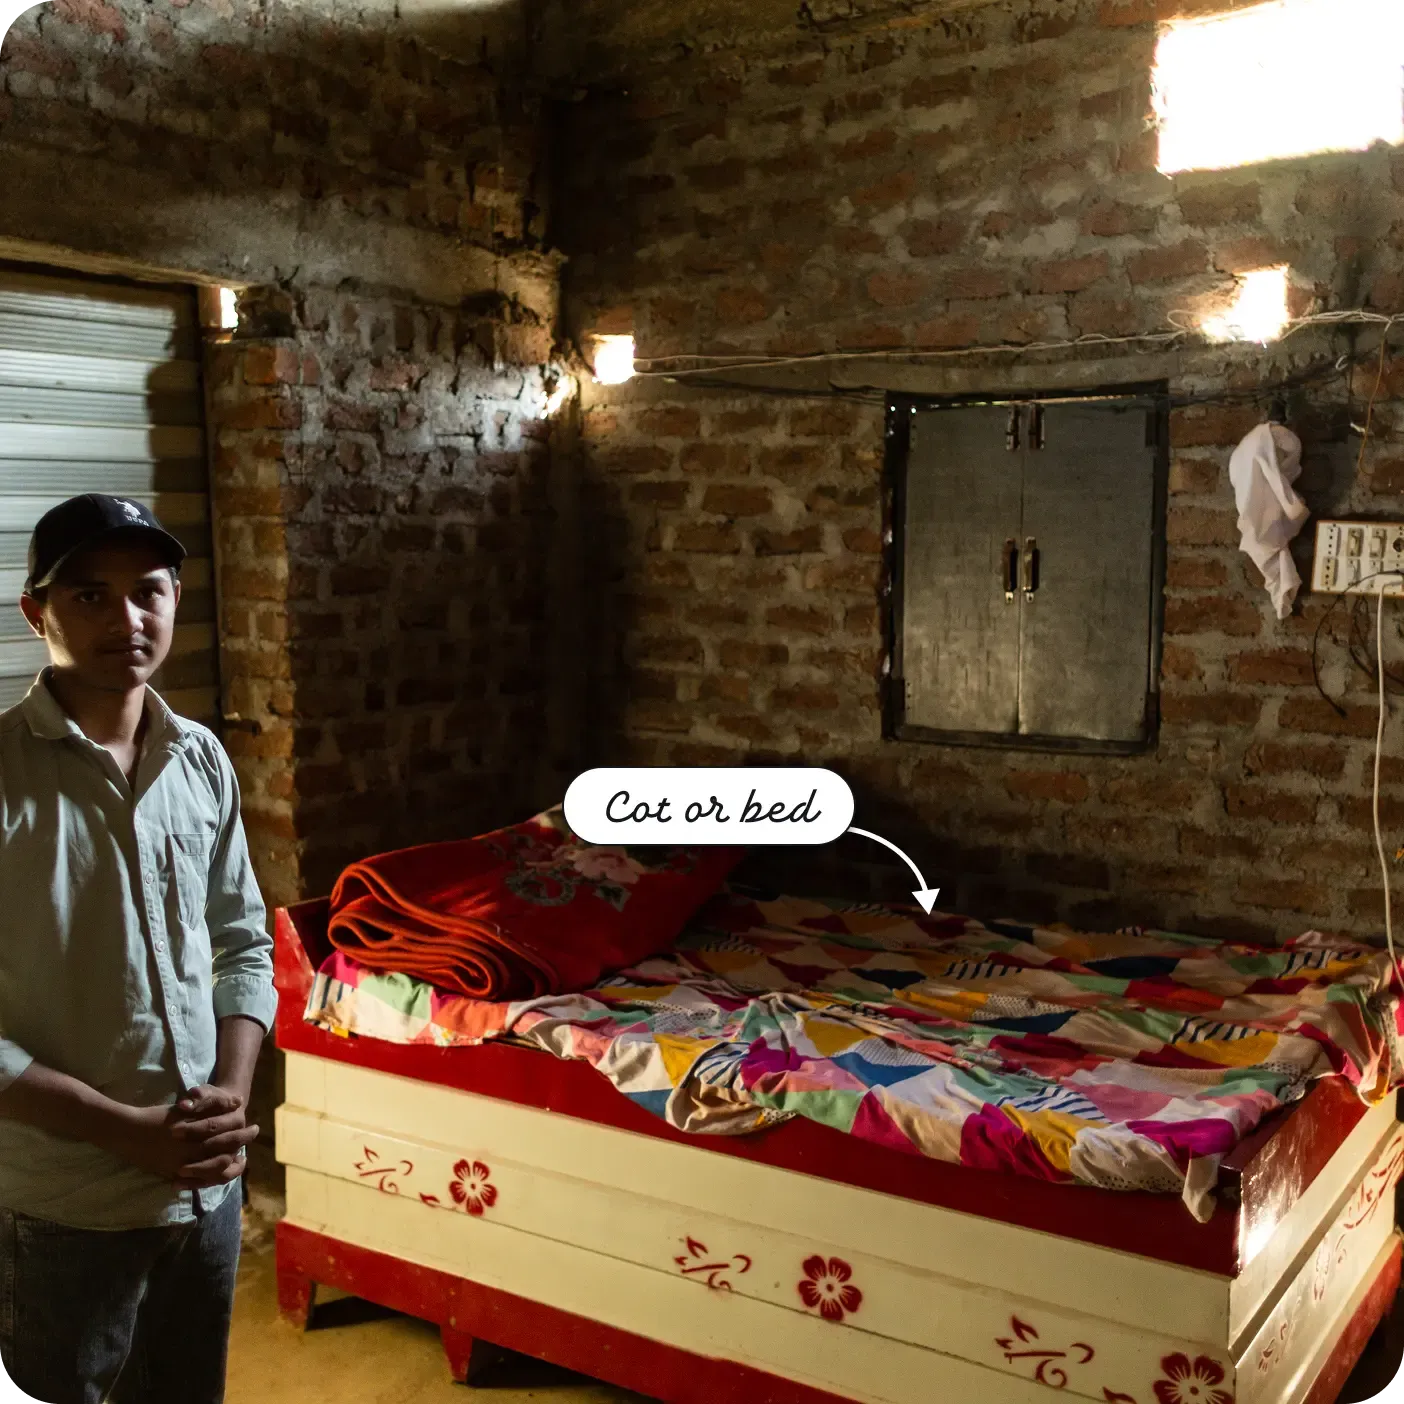
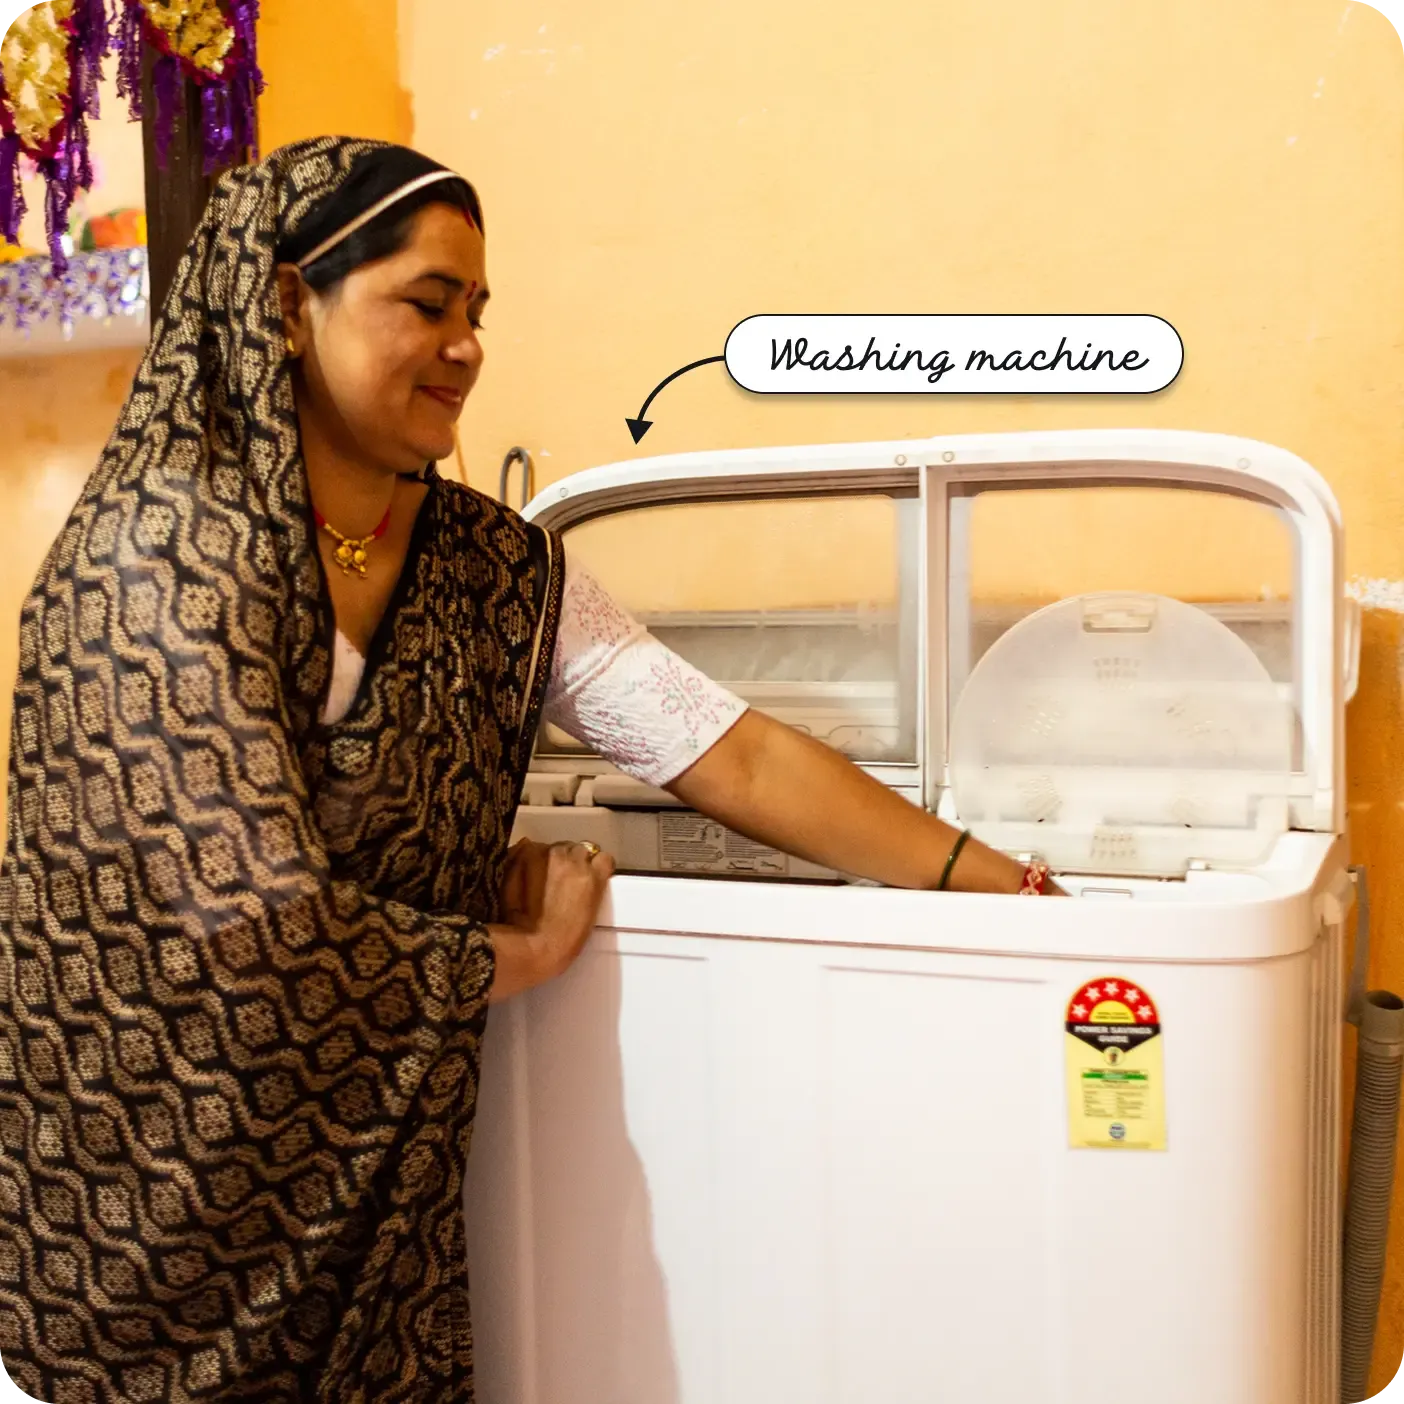
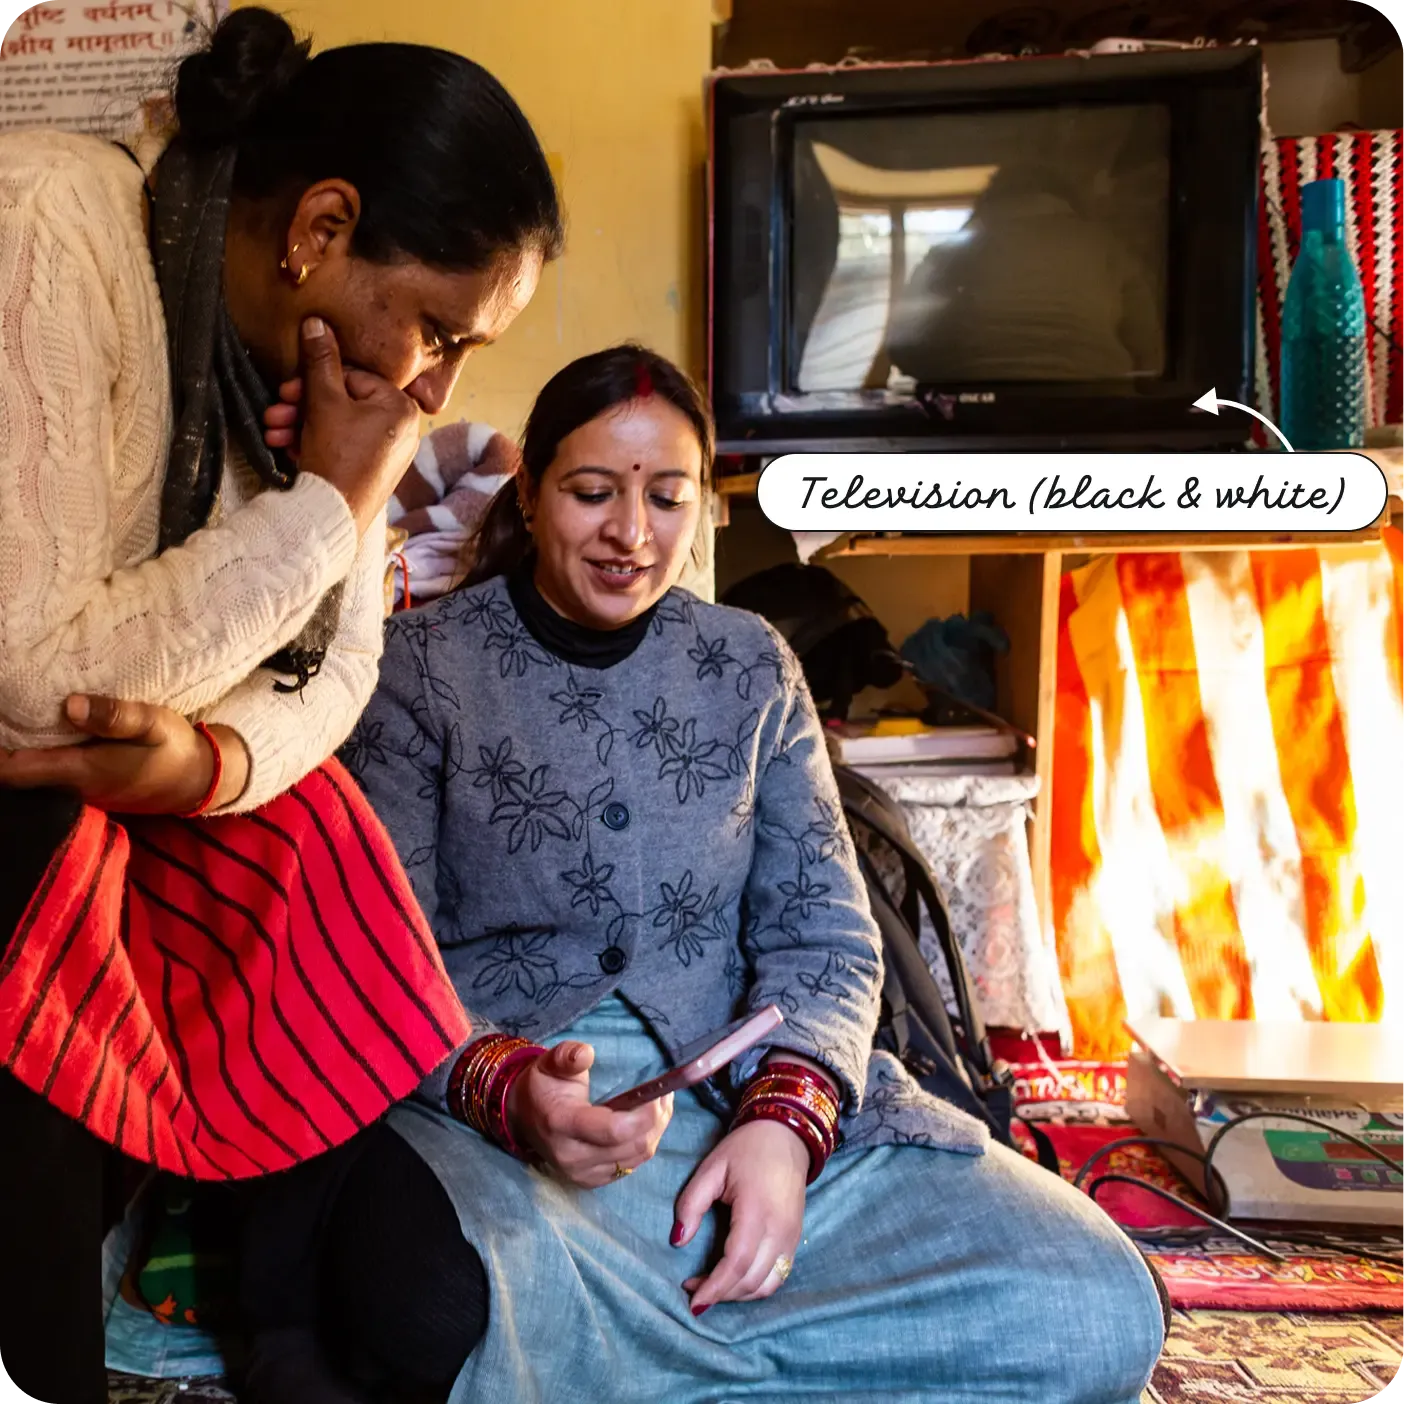
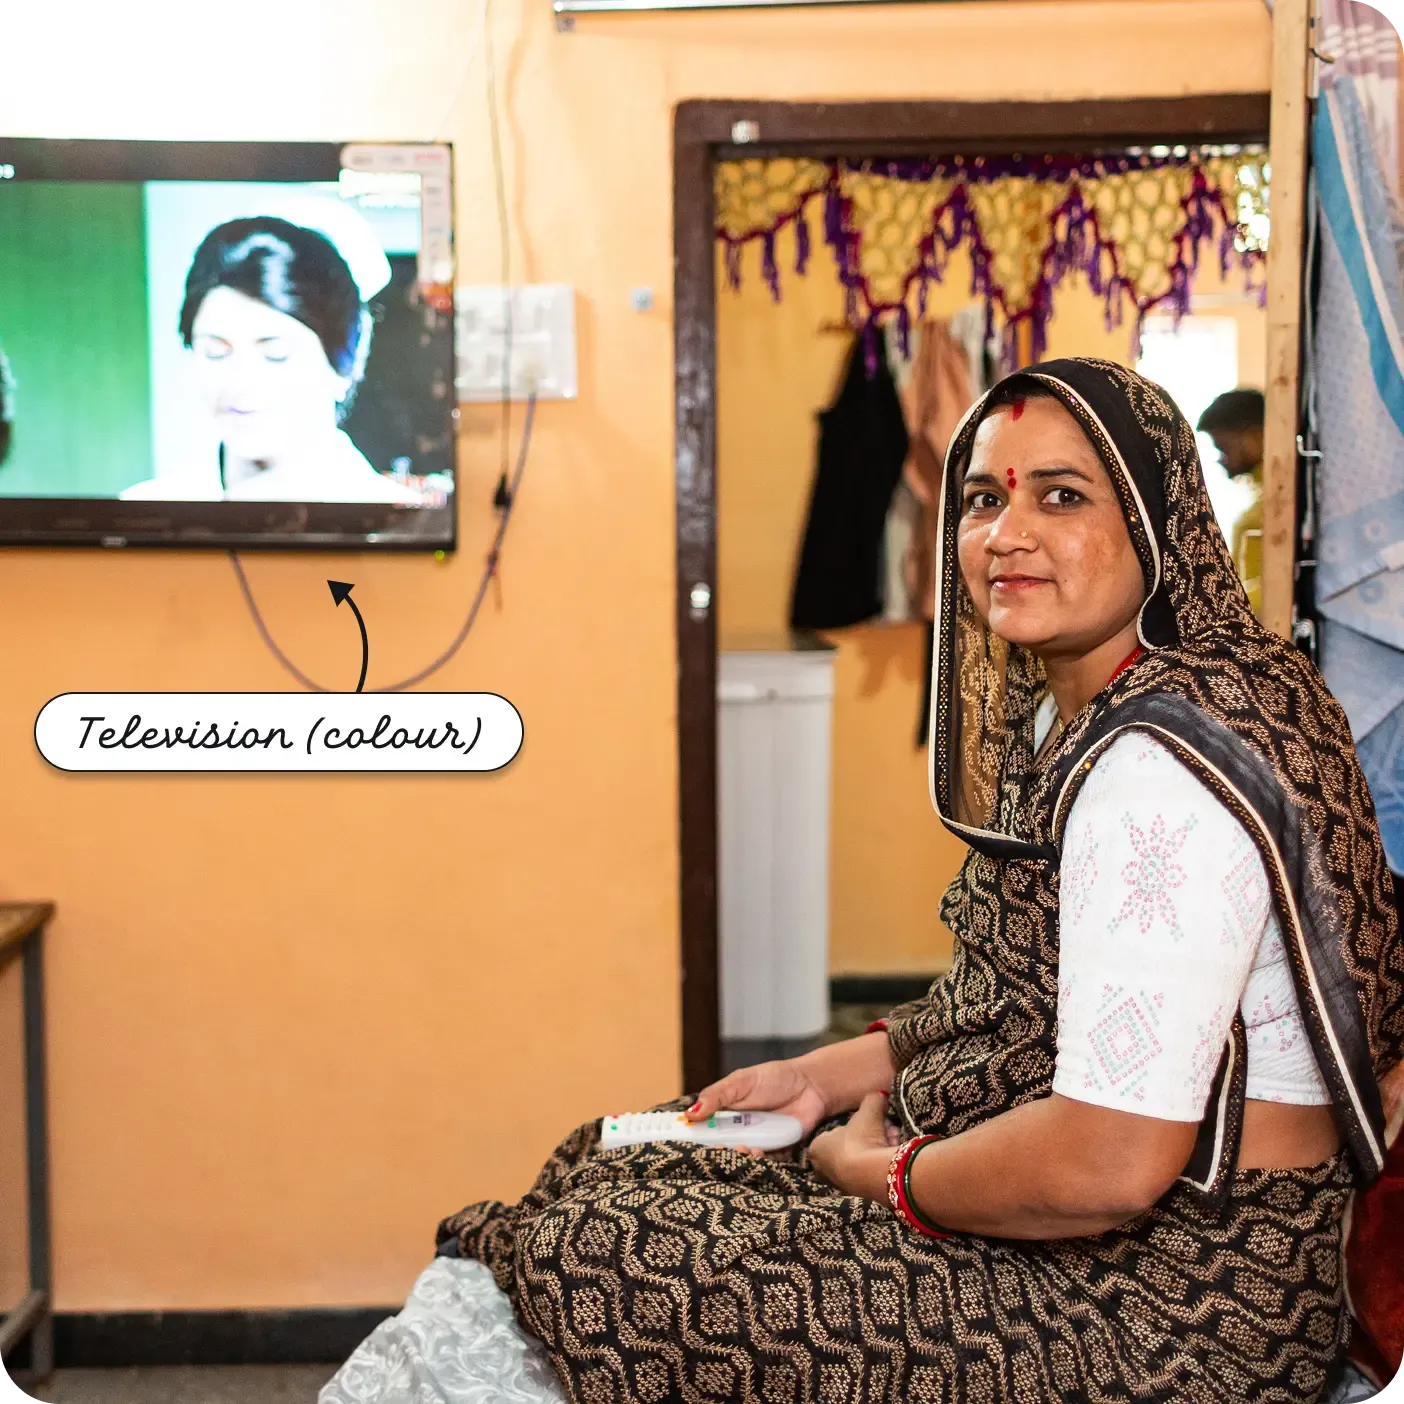
The study uses an asset-based index to measure Entrepreneurial Households’ relative economic positioning. Weights were assigned to each asset based on how rare it was within the sample. An asset that was owned by fewer households received higher weights and those owned by a higher number of households received lower weights. The respondent’s score was then calculated by adding the weights of all the assets they owned and normalizing for the maximum possible score of 14.23. The resulting index ranges from 0 to 1 and enables standardized comparison across households.


.Df5S0rhx.webp)
.CXkmnYnj.webp)